Biometric sensor accuracy claims that are too good to be true
At Valencell we see biometric sensor accuracy claims from numerous purveyors: 1) vendors who want to put their code on our Benchmark biometric sensor platform, 2) university groups that want to get a paper published, and 3) other sensor vendor claims about their products. We’ve seen a humorously painful trend in reporting sensor accuracy numbers with absurdly high R2 (correlation coefficient) values when comparing a new sensor to an established benchmark.
One recent example are claims from purveyors of cuffless blood pressure monitoring technology, a relatively new development in the marketplace. In several cases we’ve seen vendors claiming R2 values as high as 0.99 between their monitoring technology and a medical-grade blood pressure cuff. The humor part of this comes from the fact that Valencell knows these claims are comically bogus. The painful part of this comes from the fact that such claims create confusion in the marketplace, and some people actually fall for it!
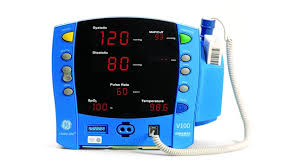
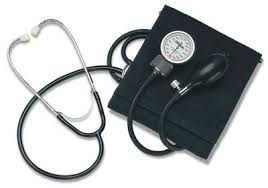
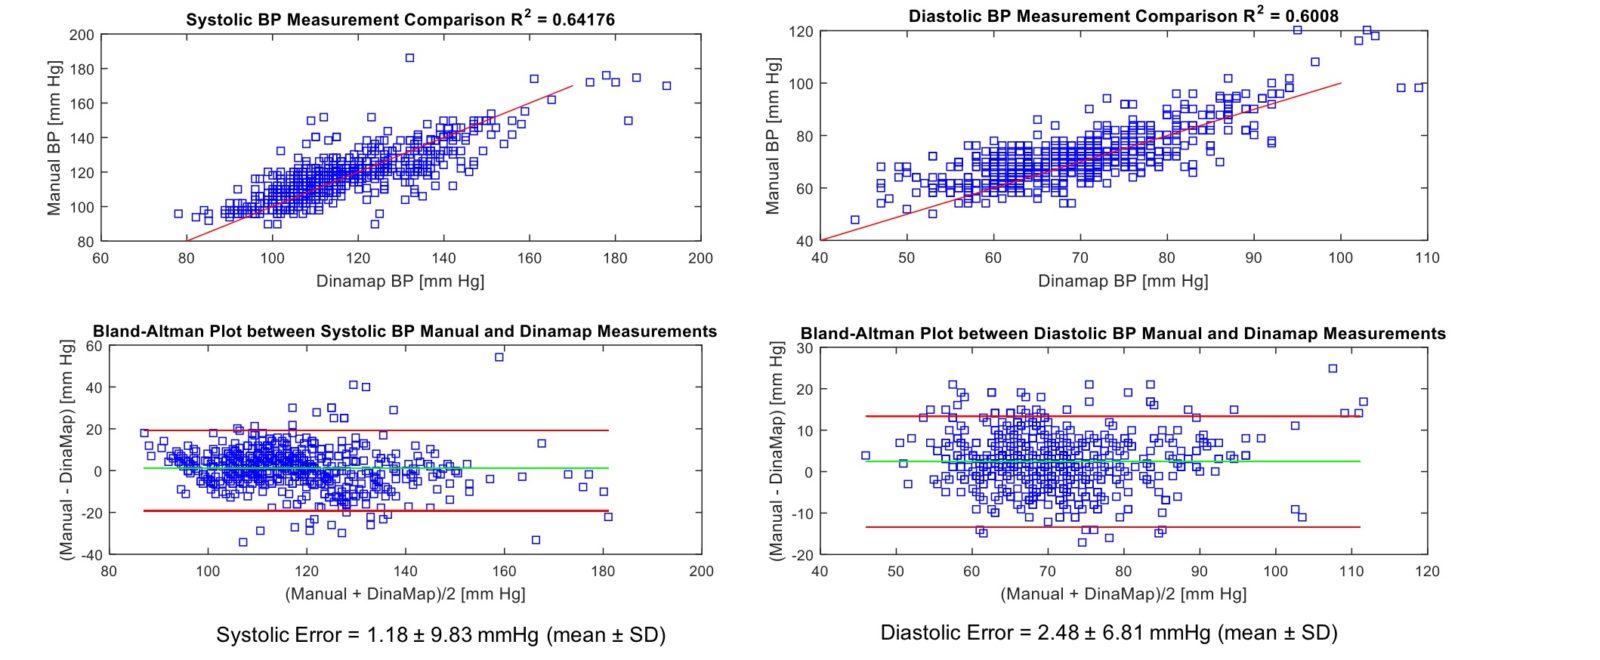
The reason we know such claims are bogus is because of extensive research in our own labs. For example, in developing our cuffless, optomechanical blood pressure monitoring technology, we’ve simultaneously collected data from our own sensor systems in comparison with two different established benchmarks for blood pressure monitoring: 1) an automated, medical-grade blood pressure cuff (the GE Dinamap) and 2) the old-school, manual method (collected via a trained professional listing to Korotkoff sounds).


To date, we’ve collected thousands of datasets on more than 2500 different participants. What we found (see below) is that even though both the cuff and manual methods each certainly track blood pressure, they do not track blood pressure the same way – the R2 value between them is as low as 0.60 in some studies, implying that perhaps as much as 40% of the variance between these two benchmark readings is not explained! Moreover, a review of the scientific literature for machine error between identical blood pressure monitors shows that the standard deviations are typically in the range of 5-to-8 mm of mercury.

Unfortunately we also see similar examples of bogus data when it comes to continuous heart rate, R-R interval, and other biometrics. The take-away is that when evaluating sensor claims from sensor suppliers, you should call the bluff on anyone who claims an R2 value that’s much higher than that between two established benchmarks. And when evaluating sensor claims from suppliers of emerging cuffless blood pressure monitoring technology, if you see an R2 that is too good to be true, it definitely is.